Quantcast
Viewing all 77 articles
Browse latest View live

Creating a mixed-mode Virtual Chassis Fabric (VCF)

In order to mix EX switches and QFX switches in the same VCF, you need to enable mixed-mode.   This requires all members of the VCF to reboot unfortunately:

{master:1}
imtech@sw0-24c> request virtual-chassis mode fabric mixed
fpc0:
--------------------------------------------------------------------------
Mode set to 'Fabric with mixed devices'. (Reboot required)

fpc2:
--------------------------------------------------------------------------
Mode set to 'Fabric with mixed devices'. (Reboot required)

fpc3:
--------------------------------------------------------------------------
Mode set to 'Fabric with mixed devices'. (Reboot required)

fpc1:
--------------------------------------------------------------------------
WARNING, Virtual Chassis Fabric mode enabled without a valid software license.
 Please contact Juniper Networks to obtain a valid Virtual Chassis Fabric License.

Mode set to 'Fabric with mixed devices'. (Reboot required)

{master:1}
imtech@sw0-24c>

Once you’ve cabled up your QSFP ports between the EX4300 you are adding and the QFX spines, you need to do the following:

Enable the VCF port on the QFX spine:

request virtual-chassis vc-port set pic-slot 0 port 48


Storm control on a QFX VCF

There don’t seem to be many operational commands in Junos to tell you what’s going on with regard to Storm Control.   Here’s all I could find – let me know if you know of more:

In the lab, I configured this storm control profile:

{master:1}
user@VCF> show configuration forwarding-options
storm-control-profiles TAT-StormControl {
     all {
         bandwidth-level 1000;
     }
     action-shutdown;
}

This was then configured on ae2, which is a trunk interface towards the Ixia tester:

{master:1}
user@VCF> show configuration interfaces ae2 unit 0
 family ethernet-switching {
     interface-mode trunk;
     storm-control TAT-StormControl;
 }


Unfortunately there’s no ‘show forwarding-options storm-control’ type command to see what interfaces have storm control configured.   I can’t find any other command that shows this info either.

So I generate 3Mbps of traffic to ff:ff:ff:ff:ff:ff from my Ixia into the VCF and the port goes disabled immediately according to the logs:

Dec 15 12:57:23 VCF l2ald[3261]: L2ALD_ST_CTL_IN_EFFECT: ae2.0: storm control in effect on the port
Dec 15 12:57:23 VCF l2ald[3261]: L2ALD_ST_CTL_DISABLED: ae2.0: storm control disabled port
Dec 15 12:57:23 VCF l2cpd[1814]: Root bridge in routing-instance 'default' changed from 4096:b0:a8:6e:0a:bd:41 to 32768:dc:38:e1:5f:c4:02
Dec 15 12:57:23 VCF mib2d[3271]: SNMP_TRAP_LINK_DOWN: ifIndex 526, ifAdminStatus up(1), ifOperStatus down(2), ifName ae2

Use the following command to verify – look for the SCTL flag:

{master:1}
user@VCF> show ethernet-switching interface ae2

Routing Instance Name : default-switch
Logical Interface flags (DL - disable learning, AD - packet action drop,
 LH - MAC limit hit, DN - interface down,
 SCTL - shutdown by Storm-control,
 MMAS - Mac-move action shutdown, AS - Autostate-exclude enabled)

Logical    Vlan    TAG   MAC     STP        Logical         Tagging
interface  members       limit   state      interface flags
 ae2.0                   294912             DN,SCTL         tagged
           VL2007 2007   294912  Discarding                 tagged
            VL549  549   294912  Discarding                 tagged


Clear the state once the problem has gone away using this command:

{master:1}
user@VCF> clear ethernet-switching recovery-timeout interface ae2

{master:1}
user@VCF> Dec 15 12:57:42 VCF /kernel: pointchange for flag 00000008 not supported on IFD ae2
Dec 15 12:57:42 VCF l2ald[3261]: L2ALD_ST_CTL_ENABLED: ae2.0: storm control enabled port
Dec 15 12:57:44 VCF l2cpd[1814]: Root bridge in routing-instance 'default' changed from 32768:dc:38:e1:5f:c4:02 to 4096:b0:a8:6e:0a:bd:41
Dec 15 12:57:44 VCF l2cpd[1814]: ROOT_PORT: for Instance 0 in routing-instance default Interface ae2.0
Dec 15 12:57:44 VCF l2cpd[1814]: TOPO_CH: for Instance 0 in routing-instance default generated on port ae2.0
Dec 15 12:57:45 VCF l2cpd[1814]: TOPO_CH: for Instance 0 in routing-instance default received on port ae2.0


{master:1}
user@VCF> show ethernet-switching interface ae2

Routing Instance Name : default-switch
Logical Interface flags (DL - disable learning, AD - packet action drop,
 LH - MAC limit hit, DN - interface down,
 SCTL - shutdown by Storm-control,
 MMAS - Mac-move action shutdown, AS - Autostate-exclude enabled)

Logical    Vlan    TAG   MAC      STP      Logical           Tagging
interface  members       limit   state     interface flags
  ae2.0                  294912            DN,SCTL           tagged
           VL2007 2007   294912 Discarding                   tagged
            VL549  549   294912 Discarding                   tagged


Unfortunately if you don’t have ‘action-shutdown’ configured, you get even less information.  I removed the action from the port – now we see 3Mbps traffic coming in on ae3 and the interface stays in forwarding.  The only message you get is a Syslog message:


{master:1}

imtech@pla-sw0-24c>

*** messages ***

Dec 15 13:23:41  pla-sw0-24c l2ald[3261]: L2ALD_ST_CTL_IN_EFFECT: ae2.0: storm control in effect on the port

imtech@pla-sw0-24c> show ethernet-switching interface ae2

Routing Instance Name : default-switch
Logical Interface flags (DL - disable learning, AD - packet action drop, LH - MAC limit hit, DN - interface down,SCTL - shutdown by Storm-control, MMAS - Mac-move action shutdown, AS - Autostate-exclude enabled)

Logical    Vlan      TAG    MAC     STP     Logica     Tagging
interface  members         limit    state   Interface  flags

ae2.0                     294912                       tagged
           VL2007   2007  294912    Forwarding         tagged
           VL549     549  294912    Forwarding         tagged

However when you look at other switch ports you can see the broadcast traffic is emerging at the storm-control-enforced rate of 1Mbps:


user@VCF> show interfaces xe-2/0/0
Physical interface: xe-2/0/0, Enabled, Physical link is Up
 Interface index: 758, SNMP ifIndex: 515
 Description: [ TO SRX CLUSTER NODE0, 0/0/9 ]
 Link-level type: Ethernet, MTU: 1514, MRU: 0, Speed: 10Gbps, BPDU Error: None, MAC-REWRITE Error: None, Loopback: Disabled, Source filtering: Disabled,
 Flow control: Disabled, Media type: Fiber
 Device flags : Present Running
 Interface flags: SNMP-Traps Internal: 0x4000
 Link flags : None
 CoS queues : 12 supported, 12 maximum usable queues
 Current address: 64:64:9b:58:b0:03, Hardware address: 64:64:9b:58:b0:03
 Last flapped : 2017-12-14 15:21:48 UTC (22:12:04 ago)
 Input rate : 856 bps (1 pps)
 Output rate : 961080 bps (235 pps)


Overall it is a bit of a shame there’s not more in the way of operational mode commands to enable you to see what is going on.  It would also be good if you could be told which VLAN had the storm in it – although in many loop situations the packets circulating might just end up being garbage, so maybe the VLAN ID might not be identifiable.

FTP and Telnet removed from OSX High Sierra (10.13.1)

For those of us that often have to use console servers to connect over IP to serial ports of devices, the removal of telnet from High Sierra is a bit of a pain in the bum.   Here are two things you can do:

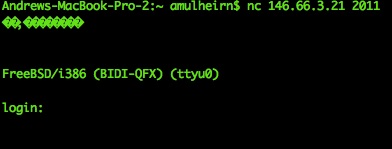
Use the ‘nc’ command to connect in exactly the same way as you used to do at the command-line with telnet.  For example:   nc <IP address> <Port Number>

Image may be NSFW.
Clik here to view.
nc

SFTP is good and I use it wherever I can, but sometimes you come across some old kit that can’t support SSH or SFTP, so you just need those old tools.   An alternative is to do this:

  1. Enter Time Machine
  2. Look for a backup taken from before your upgrade.  You can
  3. If you’re not using the time-machine interface, you can find your backup here:  /Volumes/com.apple.TimeMachine.localsnapshots/Backups.backupdb/
  4. In the appropriate backup subdirectory, look in usr/bin and you should find the telnet and ftp executable files.
  5. Copy these to your machine in /usr/local/bin


SSH tunnelling from OSX

In certain situations, I need to connect to a remote network via a bastion host but only have SSH available to me.   To get around installing some kind of VPN gateway, the easiest thing to do is to create an SSH tunnel.

In this situation, what happens is that you set up local port-forwarding.   Local port numbers are forwarded to the remote host via an SSH tunnel to the intermediate host.

The command format to do this on OSX is:

ssh -C -L <LOCAL-PORT>:<REMOTE-IP>:<REMOTE-PORT> <USERNAME>@<BASTION-HOST>

So for example, I can forward local port 1000 on my Mac to the remote device’s port 23 using this command (sudo has to be used for local ports lower than 1024):

sudo ssh -C -L 1000:10.200.0.1:23 labuser@jumpbox.customer.com

Once authenticated, I can open another terminal window and type:

telnet localhost 1000

and hey-presto, I get connected to a remote router via telnet through an encrypted SSH tunnel!   The -C parameter is for compression and isn’t actually necessary.

If you need to create a number of local port-forwards, this can be done in a config file instead.   By default SSH reads /etc/ssh/sshd_config for system-wide parameters, and also the ~/.ssh/config file (if it exists) for user-specific parameters.   I don’t want to port-forward all the time, so I will create a non-standard local config file called ~/.ssh/customer-a.cfg

In this file I put my various port-forwards in this format:

LocalForward 10000 10.200.0.1:23
LocalForward 10001 10.200.0.2:23

Once that is saved, I simply SSH once to the bastion host using the -F switch to specify the local config file that I just created:

ssh -F .ssh/customer-a.cfg labuser@jumpbox.customer.com

Once that’s authenticated, open a second window and telnet to localhost port 10000 or 10001 as required.


Juniper RADIUS-delivered switching filters

I’ve been experimenting with getting RADIUS to deploy switching filters to Juniper switches recently, as part of a reference architecture demo.  The concept is called REACH2020 and combines network virtualisation with the ability to identify network users and devices so that categories of user can be put into different virtual networks.   This leaves the firewall that connects the virtual networks together as a convenient single point of control.

Anyway, back to the matter in hand.  It turns out there’s a limit to the length of switching filter you can send a Juniper EX.

In this case, I am using Aruba Clearpass 6.6 to send some RADIUS attributes to a Juniper EX4300 switch using Junos 17.4.     What I need to do is send a web portal address that a connecting client will be redirected to, and a switching filter so that they can’t go anywhere other than the portal. The switching filter is required as far as I can tell – if you just send the portal address, Junos ignores the RADIUS attribute.

An alternative way of achieving this is to configure your centralised web authentication (CWA) web portal on every edge switch, but since RADIUS has to talk to the edge switches anyway, sending it in RADIUS attributes seemed more scalable.

Here is what works:

Image may be NSFW.
Clik here to view.
clearpass-cwa


In line 5 I am sending a VLAN ID of 41 – this is my quarantine VLAN.  In line 6, I am sending the address of the onboarding portal that users need to go to in order to access the network.

In line 7, I am sending a switching filter to the edge port that does the following:

  • Permits traffic to the portal so the client can authenticate
  • Permits traffic to the DHCP server so the client can get an address
  • Permits traffic to the DNS server so the client can look up the DNS address
  • Allows broadcast packets for the purposes of DHCP (I’ve since found that this is not actually required)
  • Permits UDP (thought I needed this for DHCP, but also not required)

If I amend this filter to add one more ‘Match Destination-ip x.x.x.x’ address to what is shown above, the filter no longer works.  I can see the RADIUS attributes being sent by Clearpass, but they are not implemented in the EX switch.

Removing the two things above that were not needed gave me the headroom to add the extra filter item.


Testing notes: simulating link failure by filtering BFD packets

In some testing I am doing, I need to prove that BFD can be used with iBGP to tell the BGP protocol when there is an interruption.  This will enable BGP to be brought down much faster than if regular BGP timers are used.

To make this easier to do, I used a firewall filter on one of the two routers to filter out BFD but accept all other packets:Image may be NSFW.
Clik here to view.

Single-hop BFD (i.e. across a link) uses UDP 3784, while multi-hop BFD uses 4784.  Since my BFD sessions are configured between loopbacks, it is this latter type I need to filter.

In the example below, CORE1 is a BGP client of CORE2, which is the route-reflector.

The following was configured on the routers to bring up the BFD session (I am only showing one side – you can figure out the mirror of this yourself I think):

[edit protocols bgp group CORE neighbor 10.0.0.6]
      bfd-liveness-detection {
          minimum-receive-interval 300;
          multiplier 3;
          transmit-interval {
              minimum-interval 100;
          }
      }

When the remote side was done, the session came up:


axians@CORE1> show bfd session
Dec 28 17:17:10
                               Detect Transmit
Address       State Interface  Time   Interval  Multiplier
10.0.0.6      Up              0.900     0.300        3


To bring down the BFD session, apply the following filter outbound on the core-facing interface(s):


axians@CORE1# show | compare rollback 2
Dec 28 17:23:33
[edit interfaces ae1 unit 0 family inet]
  filter {
    output BLOCK-BFD;
  }
[edit firewall family inet]
  filter BLOCK-BFD {
    term T1 {
      from {
        protocol udp;
        port 4784;
      }
      then {
        discard;
      }
    }
    term T2 {
      then accept;
    }
}


As soon as the filter is applied, BFD times-out and brings down the BGP session:

Dec 28 17:39:13 CORE2 bfdd[1935]: %DAEMON-4: BFD Session 10.0.0.2 (IFL 0) state Up -> Down LD/RD(16/23) Up time:00:06:07 Local diag: CtlExpire Remote diag: None Reason: Detect Timer Expiry.

Dec 28 17:39:13 CORE2 bfdd[1935]: %DAEMON-4-BFDD_TRAP_MHOP_STATE_DOWN: local discriminator: 16, new state: down, peer addr: 10.0.0.2

Pulling Configs from Cisco NSO using curl and json2yaml.py

We’re using Cisco NSO in our lab at the moment to provision L3VPNs across multi-vendor environments as part of a demo. Just noting down a few things here for future reference:

You can use the curl (command-line URL) utility to query NSO’s API and retrieve the configuration of a device it knows about. You probably know that NSO syncs a device’s config locally, so this will be a way to retrieve the device config that NSO knows about – if the device is out of sync, of course this won’t quite be the latest:

curl -u username:password -H "Accept: application/vnd.yang.data+json" http://192.168.8.172:8080/api/config/devices/device/CPE-3/config | json2yaml

I’ll break this down:

curl -u username:password – provides the username and password of your NSO installation

-H “Accept: application/vnd.yang.data+json” – specifies an HTTP header to send in the request. In this instance, we are saying that we are expecting a JSON response. Alternatively you could specify ‘vnd.yang.data+xml’ to receive an XML response.

http://192.168.8.172:8080/api/config/devices/device/CPE-3/config – this is the API request we are making. CPE-3 is the device we are requesting the configuration of.

| json2yaml – this pipes the JSON response through a python module to convert to YAML. On a Mac, you can install this using ‘pip install json2yaml’.

The output is basically a full Junos config presented in YAML format:

tailf-ncs:config:
tailf-ned-cisco-ios-xr:EXEC:
operations:
exec: /api/config/devices/device/CPE-3/config/cisco-ios-xr:EXEC/_operations/exec
junos:configuration:
version: 18.4R1.8
system:
host-name: NSO-VSRX1
root-authentication:
encrypted-password: $6$OjoDl6X88zIC48/
login:
user:
- name: axians
services: {}
syslog:
user:
- name: '*'
file:
- name: messages
- name: interactive-commands
license:
autoupdate: {}
interfaces:
interface:
- name: fxp0
- name: ge-0/0/0
routing-options:
static:
route:
- name: 192.168.0.0/16
- name: 172.16.0.0/12
autonomous-system: {}
protocols:
bgp:
group:
- name: GROUP1
policy-options:
policy-statement:
- name: REDIST-CONNECTED
security:
screen:
ids-option:
- name: untrust-screen
zones:
security-zone:
- name: trust
- name: untrust
forwarding-options:
family:
mpls:
mode: packet-based
tailf-ned-cisco-ios:EXEC:
operations:
default: /api/config/devices/device/CPE-3/config/ios:EXEC/_operations/default
exec: /api/config/devices/device/CPE-3/config/ios:EXEC/_operations/exec

3 Challenges for Network Engineers Adopting Ansible

Image may be NSFW.
Clik here to view.
Image may be NSFW.
Clik here to view.

Ansible, ansible, ansible seems to be all we hear these days. There are lots of resources out there all trying to convince us this is the new way get stuff done. The reality is quite different – adoption of tools like this is slow in the networking world, and making the move is hard for command-line devotees.

Here are the three main problems I encountered in my adoption of Ansible as a modern way to manage devices:

1. Most network devices don’t support Python

Ansible is derived from the systems world, and is only latterly coming to be used for managing network devices. It is often said that Ansible is agentless, but when managing a Linux host (for example) the control machine pushes the Ansible playbook to that host and executes it there. In effect, *Python* is the agent.

Most network devices don’t have on-box Python, so when using Ansible against a router or a switch you have to have ‘connection: local’ in your playbook:


---
name: Get info
hosts: all
roles:
Juniper.junos # Invokes the Junos Ansible module
connection: local # Tells it to run locally
gather_facts: no

What this does is run the playbook using the local Python on the control host, and then pushes the result to the target Junos device (in this case) over Netconf.


2. Credentials Storage – Many Options!

Doing things securely is very important in a production environment, but the internet is littered with lab-based examples where credentials are stored in cleartext.

There are a number of different ways that authentication can be performed with Ansible:

  • Public key authentication
  • Storing username/password in Ansible Vault – a secure storage area
  • Interactively at the command-line
  • Within the playbook (insecure and to be deprecated after Ansible 2.9)
  • As variables in the hosts file (insecure)
  • Probably others

Example of using command-line authentication:

Image may be NSFW.
Clik here to view.

3. Ansible Module Confusion

Two main hurdles present themselves to the network engineer:

Module documentation is quite often incorrect. You write a playbook but get messages about having used deprecated commands. However the module documentation still says that the commands you’ve used are mandatory. All very confusing.

Worse than that, in the case of Juniper, there are two different sets of modules to manage the Junos device.

Conclusion

For a network engineer, CLI commands are deprecated quite rarely, so this changing of things comes as something of a surprise. Someone who configured OSPF on IOS 15 years ago can probably still still do so. But that’s not the world we’re in any more when it comes to open-source software. That means version control and testing become all the more paramount.

Getting over the first two hurdles is easy enough though, so keep persevering!


Migration Strategy: Moving From MPLS/LDP to Segment Routing

MPLS core networks that use Label Distribution Protocol (LDP) are common in SP core networks and have served us well. So, the thought of pulling the guts out of the core is pretty daunting and invites the question why you would want to perform open-heart surgery on such critical infrastructure.   This article attempts to explain the benefits that would accrue from such a move and gives a high-level view of a migration strategy.

Why Do I Need Segment Routing?

Image may be NSFW.
Clik here to view.
  • Simplicity:   LDP was invented as a label distribution protocol for MPLS because nobody wanted to go back to the standards bodies to re-invent OSPF or IS-IS so that they could carry labels.  A pragmatic decision, but one that results in networks having to run two protocols.  Two protocols means twice the complexity.  
    Segment Routing simplifies things by allowing you to turn off LDP.  Instead it carries label (or Segment ID) information in extensions to the IGP.  This then leaves you with only IS-IS or OSPF to troubleshoot.  As Da Vinci reportedly said, ‘simplicity is the ultimate sophistication’. 

Image may be NSFW.
Clik here to view.
  • Scale:  LDP scales, but for fast convergence RSVP-TE is often used to tunnel LDP across a core. RSVP requires core routers to hold state for potentially many thousands of Label Switched Paths (LSPs), and as the number of these tunnels scales up, the speed at which convergence around failures can be achieved decreases.  Segment Routing requires no state to be held in the core routers – stacks of segment IDs (SIDs) are encoded into the packets at the edges of the network, enabling control of traffic flow through the whole infrastructure without complex signalling protocols like RSVP and without having to hold state in the core routers.

Image may be NSFW.
Clik here to view.

  • Multipathing:  LDP uses the shortest path as calculated by the IGP. RSVP is circuit-oriented in nature, in that a single path is signalled end-to-end.  Packets follow that path much as they would follow an ATM or frame-relay virtual circuit (am I showing my age here?).  With Segment Routing, multiple paths to the destination can be used, enabling a provider to scale-out – for example, by adding multiple smaller routers using 10G instead of being forced to upgrade to single large routers with expensive 100G interfaces.  

Image may be NSFW.
Clik here to view.

  • Speed:  Fast recovery around a fault in the LDP world relies on Loop Free Alternates (LFA), where a backup next hop is pre-installed in a router’s table in anticipation of a failure. When the failure happens, traffic switches immediately onto the alternate path while the IGP converges. There are two distinct disadvantages to this.  Firstly, the backup path may not be what the IGP ends up selecting, so convergence has to happen twice.  Secondly, LFA can cause micro-loops temporarily: upon detection of a failure of the primary path, packets are diverted to the backup next-hop but are immediately sent back to the sender because the IGP has not yet converged. Segment Routing has the concept of Topology Independent Loop Free Alternates (TI-LFA), which solves both of these issues. No micro-loops, and no double-convergence – all within 50 milliseconds. Moreover, it can be used to protect IP and LDP traffic as well as SR. What’s not to like about that?

There are quite a few other benefits such as anycast SIDs, Flex-Algo, but in the interests of keeping this brief I will leave those for another day, or you can read about them on http://segment-routing.net.

Migration Strategy

Let’s assume a relatively straightforward network topology to keep this illustration simple.  In the diagram below we have PE routers at the edge, and P-routers in the core.  The core doesn’t run BGP, and a single instance of IS-IS runs across the whole provider network.  Multi-protocol BGP (MP-BGP) is used between PE routers to signal VPN membership.  Finally, LDP is used to distribute labels throughout the network – these labels are applied to the packets for transport.

Image may be NSFW.
Clik here to view.
LDP end-to-end

We will play it safe and go with a gradual migration strategy.  Our core will be migrated first, leaving islands of LDP around the edge:

Image may be NSFW.
Clik here to view.
Islands of LDP around a Segment Routing Core

Finally, we will enable SR at the edge, and remove LDP from the picture altogether.

Image may be NSFW.
Clik here to view.
SR end-to-end

1 – Enable Segment Routing on Core

Firstly, we need to set a few things up on all our routers:

  • Configure the Segment Routing Global Block (SRGB) – must be the same on all routers
  • Configure the Node Segment ID (Node SID) – must be unique to each router (or bad things will happen)

This kind of work is ideally suited to automation:  an Ansible playbook could be written using a Jinja2 template to push the required configuration to all the core routers. Making the changes this way would ensure consistency where the config needs to be uniform across routers, and uniqueness where the config needs to be different.

In IOS, the required configuration for this would be as follows. This router would get a node-SID of 20001:

router isis ISIS-CORE
 net 49.1000.1000.0001.00
 segment-routing global-block 20000 21000  
 address-family ipv4 unicast
  segment-routing mpls
interface Loopback0
  address-family ipv4 unicast
   prefix-sid absolute 20001

In Junos the equivalent config below would give this router a Node-SID of 20002:

set protocols isis source-packet-routing srgb start-label 20000
set protocols isis source-packet-routing srgb index-range 1000
set protocols isis source-packet-routing node-segment ipv4-index 2
set interfaces lo0 unit 0 family iso address 49.1000.1000.0002.00
set interfaces lo0 unit 0 family mpls

Once this is done, the IGP on the P-routers will advertise SIDs, but Segment Routing won’t be in use yet. LDP still exists everywhere remember, and in both IOS and Junos LDP routes have a higher preference than IS-IS routes.  

So now, your configuration can now be verified at your leisure.  Check the routing table and look for SIDs in the IS-IS routes to make sure everything is working as expected.

2 – Enable TI-LFA

Next, we need to enable TI-LFA on the P-routers.  This will provide protection for all traffic types running across the core and protects that traffic against both link and node failure. Naturally, you would probably have Bi-Directional Forwarding Detection – BFD configured on all your core links too so that failure detection is rapid, but that is outside the scope of this document.


In IOS, this is turned on per interface:

router isis ISIS-CORE
interface GigabitEthernet2
fast-reroute per-prefix ti-lfa
fast-reroute per-prefix tiebreaker node-protecting index 100

The Junos equivalent to this would be:

set protocols isis backup-spf-options use-post-convergence-lfa maximum-labels 5
set protocols isis interface ge-0/0/0 level 2 post-convergence-lfa

3 – Enable LDP and SR Interworking

At the moment, we have SR on the P-routers, and LDP is still running network-wide.  When we turn off LDP on the P-routers, we will create islands of LDP around the edge of the network.  We need a way for these islands to communicate until the time when we have SR running everywhere.

To do this we enable something called a Segment Routing Mapping Server. There are two components and you need both:

  • Segment Routing Mapping Server (SRMS)– Allows SR-only routers to reach LDP-only routers.  The SRMS generates node-SIDs on behalf of the LDP-only routers, and advertises them into the SR domain.   A different router with a leg in both SR and LDP then has to be configured to stitch the SR and LDP labels together.  You would probably have two SRMS to ensure resilience in the event of failure.

  • SR mapping client– Allows LDP-only routers to reach SR-only routers.  The client is a router with a leg in both SR and LDP domains which allocates LDP labels to all SR node-SIDs it knows about and advertise them into the LDP domain.  Again, a pair of these is recommended at each SR/LDP boundary.

4 – Remove Protocols

Once the inter-working tasks are complete, LDP can be removed from the P-routers on a link-by-link basis.  Working one link at a time, remove LDP from both ends – of course the routers on each end must have SR enabled on them before you do this.

By the end of this, we should have achieved our “SR core and LDP islands” topology.

Pushing SR to the Edge

Of course, not all edge devices are going to support SR at this stage, so there may well be a case where an island of LDP needs to continue to exist. However, our goal is to remove complexity, and SR has been around for a while so let’s assume our edge supports it.   

Pushing SR out to the edge is a two-step process, and is similar to that used when migrating between IGPs:

1 – Enabling SR at the Edge

The same process can be followed for the PE routers as was used on the P-routers.  Once node-SIDs are configured and the SRGB has been defined, we should start seeing IS-IS prefixes with segment routing information in them in the PE-routers’ tables.  At this stage, Junos prefers the LDP prefixes, and if you are using IOS-XR the situation is the same.   So, verification can be performed that end-to-end SR reachability is achievable, while the transport of packets remains with LDP.

2 – Turning On SR at the Edge

Two alternatives exist here.  The first is simply to disable LDP on a link-by-link basis.  The LDP entries disappear from the tables and are replaced by SR ones.

Instead of doing this, it may be preferable to migrate an entire PE router at once.  In this case, IOS-XR offers the ‘sr-prefer’ command.  This is an easy way to change the Administrative Distance (AD) of the prefixes.   In Junos, you simply change the preferenceof the LDP protocol.

Once validation is complete, and assuming no islands of LDP remain, the protocol and the SRMS configuration can be removed from the network.  Bada-bing! You’ve got yourself a Segment Routing network from end to end.

Image may be NSFW.
Clik here to view.
SR end-to-end

DHCP Relay Issues With Microsoft Surface Pro Docks and Junos

After deploying some new Juniper EX4600 core switches, my customer complained that he was experiencing about 45 seconds of delay in getting an IP address on a Surface Pro connected to a dock. The second time of connecting, it took about 8 seconds which was more acceptable. The 45 second delay came back every time they moved the Surface Pro to a new dock.

After ruling out a few things like Spanning Tree and LLDP, we isolated it down to the core switch. An older core switch elsewhere was configured for BootP Helper rather than DHCP relay, and clients connected to that did not have the problem.

Other devices didn’t exhibit the problem either – a Macbook was given an IP in the region of 4 seconds after connecting. The Surface Pro took 8 seconds consistently to connect when using a USB dongle. So the issue seemed to centre around the dock.

If you haven’t seen one of these before, they look like this – a black brick with some ports on it, supplied with power by another black brick:

Image may be NSFW.
Clik here to view.

The wire to the right of the image above ends in an edge connector that is plugged on to the side of the Surface Pro.

On its own, the dock does not bring up the network port’s link light – only when a Surface is connected does link come up. Written in grey on the black underside of the dock is the MAC address. So basically, the dock has the network adapter inside it, and when a Surface moves to another dock it is like changing network adapters – unlike the Macbook, or the USB dongle mentioned above which move with the Surface as it connects to different ports.

I turned on some traceoptions under the system stanza:

processes {
    dhcp-service {
        traceoptions {
            file dhcp.log size 2m;
            flag all;
        }
    }
}

With this enabled I could see that when a Surface moved to a new dock, Junos was complaining that the IP address was already in use by another MAC address:

Sep 7 10:48:51 SWITCH jdhcpd: DH_SVC_DUPLICATE_IPADDR_ERR: Failed to add 172.16.2.102 as it is already used by 1618

What has happened here is that Windows has remembered the IP address it had at docking station A, and has asked for the same IP address again in its initial DHCP DISCOVER packet, sent from docking station B. But as we know, the docking station has the MAC address, not the Surface Pro, so from Junos’s point of view, the client is different, but requesting an IP address that is already in use.

After the error above comes up, there is a 45 second delay, during which time nothing much appears in the log file. Looking at the DHCP relay bindings for the MAC address on the base of docking station B repeatedly, we see about 35 seconds of nothing, then 13 seconds of ‘SELECTING’ state, and finally a new binding with a new IP address:

{master:0}
admin@SWITCH> show dhcp relay binding | match bc:83:85:f6:61:99
0.0.0.0 1634 bc:83:85:f6:61:99 0 SELECTING irb.32

{master:0}
admin@SWITCH> show dhcp relay binding | match bc:83:85:f6:61:fb
172.16.2.116 1634 bc:83:85:f6:61:99 691199 BOUND irb.32

This is how DHCP works – it asks for the IP it had before, and if it can’t use that it requests a fresh one. If the DHCP server is authoritative, and the requested IP is already used, the client should get a DHCP NAK. However, it seems that the client wasn’t getting the NAK and instead waited 45 seconds before trying for a fresh IP.

This situation was resolved by making DHCP relay behave more like BootP helper – turning off the bindings using this command:

set forwarding-options dhcp-relay forward-only

I hope this helps someone out there.

Restoring data to Netbox Docker

Having just shot myself in the foot by deleting docker and losing a container I had been working on, here is the command to restore data to netbox-docker’s Postgres database:

sudo docker exec -i netbox-docker_postgres_1 psql --username netbox netbox < /path/to/backup/file.sql

Phew…

fpc1 vlan-id(32768) to bd-id mapping doesn’t exist in itable

If you are getting this message appearing repeatedly on a Juniper switch (e.g. an EX4300), check you don’t have an IRB interface that is not attached to a VLAN. Alternatively, check your IRBs all have IP addresses.

Cable testing on Juniper EX switches

Does anyone use the cable test feature on EX switches? Did you even know you could do this kind of thing?

In case you didn’t, here is a bit of background and an example.

The Time Domain Reflectometer (TDR) test has been available on the EX switches for some time, but not a lot of people seem to know about it. What is TDR, I hear you ask?

A futuristic-sounding thing, what a TDR does is send a signal down a cable and measure how much (if any) is reflected by the far end. If the cable is damaged a little way along its length, the TDR test will tell you that distance to a fair level of accuracy.

In an ethernet cable, there are four pairs of conductors – eight wires in total. The operative ones are 1 & 2, and 3 & 6. The other conductors are unused but their presence in the Cat5 or Cat6 cable helps prevent cross-talk and signal attenuation. In a lab, usually cables are fairly short and easily replaced, but in a working environment, cables in floor-boxes under desks, or the structured wiring under the raised floor in an office often suffers quite badly from being crushed, bashed or otherwise assaulted.

For this reason, it is very useful to have a ready-made piece of test gear attached to every cable in your building ready to make a diagnosis. What better place for that test device to be than in your Juniper network switches?

Here’s how it works. First, you need to know what port you have an issue with. If the problem computer and the network switch are far apart, you can do that easily using ‘monitor start messages’ and getting someone to connect/disconnect the device so you can work out which port it is in.

Once you know which port it is, run the TDR test using request diagnostics tdr start interface <interface name>:

Image may be NSFW.
Clik here to view.

Then display the results using show diagnostics tdr interface <interface name>:

Image may be NSFW.
Clik here to view.

As you can see in the screenshot above, conductors 4 and 5 are ‘open’ meaning there is a cable break 1 metre from the switch port. If all conductors came up as ‘open’ this would mean the whole Cat5 cable was not plugged in, but since only a single pair out of the four is open, this means there’s something plugged in, but one pair is faulty. In this instance, tbe the break is 1 metre away, so we can be confident it is the patch lead from switchport to patch panel.

Here’s what it looks like when the cable has been removed from the switch port – all pairs are ‘open’ with a distance of 0 metres to the cable break:

Image may be NSFW.
Clik here to view.

Here is the same port with a new cable in at the wiring closet end, but nothing connected out at the desk port – 33 metres away as you can see:

Image may be NSFW.
Clik here to view.

Suppose you had some pairs open at 33 metres, and other pairs open at different distances? In that case, I’d say there’s nothing on the end of the cable, and that the structured wiring under the floor is damaged – mark the port on the patch panel as bad and avoid it!

TDR can tell you other things too – occasionally, this cable run was experiencing cross-talk too – strangely at 123 metres rather than the 31 metres we see above when there’s no device on the end. It is likely that the crosstalk messes up the TDR measurement somehow:

Image may be NSFW.
Clik here to view.

Here’s the same port, now with a device on the end of the cable run, and new patch cables installed – no open pairs at all now:

Image may be NSFW.
Clik here to view.

Now it is all looking good.

TDR can tell you a variety of other things – cable shorts, downshift to 10 or 100Mbps speeds where it should be 1G, swapped pairs etc. There is a more full description of the results of the test at the Juniper site here.

Public/private key SSH access to Fortigate

To save having to enter usernames and passwords for your devices, it is a lot more convenient to use public/private key authentication. When SSHing to the device, you simply specify the username and authentication using the keys is automatic.

Windows users can use puttygen to make key pairs, and PuTTY as an SSH client to connect to devices. This process is quite well described here: https://www.ssh.com/ssh/putty/windows/puttygen

By default, keys (on a Linux or Macos host) are in your home directory, under the ~.ssh/ directory. A keypair is generated using ssh-keygen like so:

andrew@host % ssh-keygen
Generating public/private rsa key pair.
Enter file in which to save the key (/Users/andrew/.ssh/id_rsa): andrew_test
Enter passphrase (empty for no passphrase):
Enter same passphrase again:
Your identification has been saved in andrew_test.
Your public key has been saved in andrew_test.pub.
The key fingerprint is:
SHA256:nx4REDACTEDGN69tY andrew@host
The key's randomart image is:
+---[RSA 3072]----+
| 1. o+|
| o o& o|
| * o..- =.|
| .. |
| S. =B xx . |
| .+. |
| . +.=. o. +E|
| o o+* .|
+----[SHA256]-----+
andrew@host %

In the example above, I created it as ‘andrew_test’ – this will make two files – andrew_test and andrew_test.pub. The first one is your PRIVATE key and should remain secure on your system. The second is your PUBLIC key which you can distribute. If you don’t specify a name, default it will create files called id_rsa and id_rsa.pub.

You can do a ‘more andrew_test.pub’ to see the contents of this file. Copy it to the clipboard because you need it in the next step.

Note: For extra security, if I had specified a passphrase in the section above, I would have to enter that phrase every time the key is used. In this example, I did not set a passphrase.

Log into the Fortigate you wish to administer and create a new user like so, pasting the cryptotext you found in the .pub file between quotation marks:

config system admin
edit <new username>
set ssh-public-key1 "<PASTE CRYPTOTEXT HERE>"
set accprofile super_admin
set password <password>
end

NOTE: Make sure you add a password for the user – otherwise, when logging on via the serial port (which does not support public/private key authentication), no password will be required!

Then exit from that login session, and log in again as the user you defined.

If you specified a custom name for your keypair, you need to do the following:

ssh -i ~/.ssh/<key-name>.pub <new username>@<fortigate IP>

If you didn’t specify a name, it will use the id_rsa.pub file by default, so you can simply type:

ssh <new username>@<fortigate IP>

Here is a working example of this last case – as you can see, there’s no prompt for a password:

andrew@host % ssh andrew@10.0.0.25
Fortigate-Test #

Notes on Pushing Ansible-generated FortiOS Configs

I’m working on a project to push out configuration files to Fortigates using the ‘configuration restore’ capability in FortiOS. The configs are generated using Jinja2 templates and then restored to the remote device via SCP. This post is to collect together a few of the pitfalls and things I learned in the process. Hopefully it will help someone else out of a hole.


Why use SCP in the first place?

I had every intention of using the FortiOS Ansible modules for this process, specifically fortinet.fortios.fortios_system_config_backup_restore. The issue with doing so is that it operates over the REST API. To use the API, you have to go on to the box and generate an API token. The issue here is that you only see the token in cleartext at the point of creation, after which it is stored cryptographically in the config. This means that on the script host you need to keep a vault with both versions – cleartext to push to the API, and cryptotext to insert into the config file you are pushing.

Instead, it is easier to enable SCP on the devices, put an admin PKI user’s public key in every config and restore over SCP instead. To do this:

config system global     
  set admin-scp enable
end
config system admin
  edit scripthost
    set accprofile prof_admin ssh-public-key1 "ssh-rsa YOUR PUBLIC KEY HERE"
  next
end


SCP Backups Pitfall

Backup over SCP using the PKI key is achieved as follows – make sure you are backing up the file sys_config from the remote Fortigate:

scp -i <private key> scripthost@<device IP>:sys_config <local filename> 

The pitfall here is that (at least in FortiOS 6.4.3) only the admin user that is doing the backing up is included in the file that is retrieved. So if you restore that file, all the other admin users are missing! If you do a backup/restore via the GUI or the API, it seems as though all admin users are backed up.

Ungraceful SCP Connections

By default, when you restore via SCP to FortiOS (this is 6.4.3), the device immediately reboots when it gets its config. This leaves the client SCP session hanging until the SCP program times out. Not particularly nice because in an ansible playbook it takes ages to time out and the result appears as a failure, even though the restore was successful.

You can work around this by messing with timeouts on the SCP client but ultimately, the SCP client still sees the graceless disconnection as a failure.

Instead, a CLI-only command in FortiOS exists to prevent the device rebooting after a config restore. Use this and the SCP session is terminated gracefully after restoration:

config system global
set reboot-upon-config-restore disable
end

Important Things in the Configuration

There are two lines that need to be in the configuration file that you create using Jinja. If they’re not there, the Fortigate will tell you that the configuration is invalid.

At the very top of the configuration, you need to make sure that Jinja makes this line. In the example below, the model of Fortigate is FGVM64 (a virtual Fortigate). If this does not match the device type you are sending a config to, it will reject it as invalid. Other models exist of course – e.g. FGT60E, FGT60F – just make sure the model matches. Other fields here have to exist, but do not appear to have to match anything:

#config-version=FGVM64-6.4.3-FW-build1778-201021:opmode=0:vdom=0:user=andy

Immediately below that there needs to be this:

#config-version=UNKNOWN

The version line needs to be there but as you can see, I put a dummy value in it. The actual version will be written by FortiOS when the file is saved to the device.


Installing AWX 19 on MicroK8s in AWS

AWX is now deployed on Kubernetes (since AWX release 18), which is great – the only thing is, what do you do if this is the only application you need Kubernetes for? It is a bit of a hassle setting up the K8s master and worker nodes just for a single application.

The documentation suggests you use Minikube for this, but that seems to be designed for local / testing use only. There’s no middle ground between these two options, so I decided to work it out on MicroK8s.

MicroK8s is Canonical’s minimal production Kubernetes environment. It installs on one host, but can be set up for high availability and even run on a Raspberry Pi!

Here are the instructions if you want to do the same.

Install an Ubuntu 20 host on a t2.medium or higher instance in AWS.

Give it 20Gb of general purpose SSD disk.

Create a security group that permits TCP/443 through from your location – only TCP/22 is permitted by default.

Install Microk8s on a new Ubuntu host in AWS:

ubuntu@ip-172-31-0-208:~$ sudo snap install microk8s --classic
microk8s (1.20/stable) v1.20.5 from Canonical✓ installed
ubuntu@ip-172-31-0-208:~$

Add the ‘ubuntu’ user you are logged in as to the microk8s user group, then log out and back in again:

ubuntu@ip-172-31-0-208:~$ sudo usermod -a -G microk8s $USER
ubuntu@ip-172-31-0-208:~$ sudo chown -f -R $USER ~/.kube
ubuntu@ip-172-31-0-208:~$ exit

Log back in again to acquire the rights. Then check microk8s is running:

ubuntu@ip-172-31-0-208:~$ microk8s status
microk8s is running
high-availability: no
  datastore master nodes: 127.0.0.1:19001
  datastore standby nodes: none
addons:
  enabled:
    ha-cluster           # Configure high availability on the current node
  disabled:
    ambassador           # Ambassador API Gateway and Ingress
    cilium               # SDN, fast with full network policy
    dashboard            # The Kubernetes dashboard
    dns                  # CoreDNS
    fluentd              # Elasticsearch-Fluentd-Kibana logging and monitoring
    gpu                  # Automatic enablement of Nvidia CUDA
    helm                 # Helm 2 - the package manager for Kubernetes
    helm3                # Helm 3 - Kubernetes package manager
    host-access          # Allow Pods connecting to Host services smoothly
    ingress              # Ingress controller for external access
    istio                # Core Istio service mesh services
    jaeger               # Kubernetes Jaeger operator with its simple config
    keda                 # Kubernetes-based Event Driven Autoscaling
    knative              # The Knative framework on Kubernetes.
    kubeflow             # Kubeflow for easy ML deployments
    linkerd              # Linkerd is a service mesh for Kubernetes and other frameworks
    metallb              # Loadbalancer for your Kubernetes cluster
    metrics-server       # K8s Metrics Server for API access to service metrics
    multus               # Multus CNI enables attaching multiple network interfaces to pods
    portainer            # Portainer UI for your Kubernetes cluster
    prometheus           # Prometheus operator for monitoring and logging
    rbac                 # Role-Based Access Control for authorisation
    registry             # Private image registry exposed on localhost:32000
    storage              # Storage class; allocates storage from host directory
    traefik              # traefik Ingress controller for external access
ubuntu@ip-172-31-0-208:~$ microk8s kubectl get services
NAME         TYPE        CLUSTER-IP     EXTERNAL-IP   PORT(S)   AGE
kubernetes   ClusterIP   10.152.183.1   <none>        443/TCP   12m
ubuntu@ip-172-31-0-208:~$ microk8s kubectl get nodes
NAME              STATUS   ROLES    AGE   VERSION
ip-172-31-0-208   Ready    <none>   12m   v1.20.5-34+40f5951bd9888a

Enable persistent storage on the cluster.  Without this, Postgres container will fail to start:

ubuntu@ip-172-31-0-208:~$ microk8s enable storage
Enabling default storage class
deployment.apps/hostpath-provisioner created
storageclass.storage.k8s.io/microk8s-hostpath created
serviceaccount/microk8s-hostpath created
clusterrole.rbac.authorization.k8s.io/microk8s-hostpath created
clusterrolebinding.rbac.authorization.k8s.io/microk8s-hostpath created
Storage will be available soon

Enable DNS so that containers can reach each other using DNS names within the pod:

ubuntu@ip-172-31-0-208:~$  microk8s enable dns
Enabling DNS
Applying manifest
serviceaccount/coredns created
configmap/coredns created
deployment.apps/coredns created
service/kube-dns created
clusterrole.rbac.authorization.k8s.io/coredns created
clusterrolebinding.rbac.authorization.k8s.io/coredns created
Restarting kubelet
DNS is enabled

If you don’t enable DNS, you will see errors like ‘name or service not known’ in the logs:

ubuntu@ip-172-31-0-208:~$ sudo tail -f /var/log/pods/default_awx-6dbb9946c7-86zhh_ffa0203-c8fe-4c1f-a2b3-7d294dbd084e/awx-web/0.log
2021-04-13T08:22:51.29771604Z stderr F File "/var/lib/awx/venv/awx/lib64/python3.8/site-packages/django/db/backends/base/base.py", line 217, in ensure_connection2021-04-13T08:22:51.297720294Z stderr F self.connect()2021-04-13T08:22:51.297760208Z stderr F conn = _connect(dsn, connection_factory=connection_factory, **kwasync)2021-04-13T08:22:51.297764847Z stderr F django.db.utils.OperationalError: could not translate host name "awx-postgres" to address: Name or service not known2021-04-13T08:22:51.297768742Z stderr F

Enable an ingress controller – this will permit inbound access to the AWX service and will terminate the SSL/TLS session from the browser.

ubuntu@ip-172-31-0-208:~$ microk8s enable ingress
Enabling Ingress
ingressclass.networking.k8s.io/public created
namespace/ingress created
serviceaccount/nginx-ingress-microk8s-serviceaccount created
clusterrole.rbac.authorization.k8s.io/nginx-ingress-microk8s-clusterrole created
role.rbac.authorization.k8s.io/nginx-ingress-microk8s-role created
clusterrolebinding.rbac.authorization.k8s.io/nginx-ingress-microk8s created
rolebinding.rbac.authorization.k8s.io/nginx-ingress-microk8s created
configmap/nginx-load-balancer-microk8s-conf created
configmap/nginx-ingress-tcp-microk8s-conf created
configmap/nginx-ingress-udp-microk8s-conf created
daemonset.apps/nginx-ingress-microk8s-controller created
Ingress is enabled
ubuntu@ip-172-31-0-208:~$

Install the AWX operator:

ubuntu@ip-172-31-0-208:~$ microk8s kubectl apply -f https://raw.githubusercontent.com/ansible/awx-operator/devel/deploy/awx-operator.yaml
customresourcedefinition.apiextensions.k8s.io/awxs.awx.ansible.com unchanged
clusterrole.rbac.authorization.k8s.io/awx-operator configured
clusterrolebinding.rbac.authorization.k8s.io/awx-operator unchanged
serviceaccount/awx-operator unchanged
deployment.apps/awx-operator configured
ubuntu@ip-172-31-0-208:~$

Check it is running after a few mins (on an Ubuntu host in an AWS t2.medium instance, this takes about 35 seconds):

ubuntu@ip-172-31-0-208:~$ microk8s kubectl get all
NAME                              READY   STATUS    RESTARTS   AGE
pod/awx-operator-f768499d-4xvdd   1/1     Running   0          56s

NAME                           TYPE        CLUSTER-IP       EXTERNAL-IP   PORT(S)             AGE
service/kubernetes             ClusterIP   10.152.183.1     <none>        443/TCP             16m
service/awx-operator-metrics   ClusterIP   10.152.183.140   <none>        8383/TCP,8686/TCP   26s

NAME                           READY   UP-TO-DATE   AVAILABLE   AGE
deployment.apps/awx-operator   1/1     1            1           56s

NAME                                    DESIRED   CURRENT   READY   AGE
replicaset.apps/awx-operator-f768499d   1         1         1       56s
ubuntu@ip-172-31-0-208:~$

Create a key and self-signed certificate, perhaps using a bigger value than 365 days shown below so it doesn’t expire soon.  Make sure you have the FQDN in the subject alternative name (SAN) since this seems to be how the ingress controller knows which container to send traffic to.  Without it you get messages about SAN in the logs:

ubuntu@ip-172-31-0-208:~$ openssl req -x509 -nodes -days 365 -newkey rsa:2048 -keyout awx.key -out awx.crt -subj "/CN=awx.yourname.com/O=awx.yourname.com" -addext "subjectAltName = DNS:awx.yourname.com"
Generating a RSA private key
..................................................................................................................................................................................................................+++++
...+++++
writing new private key to 'awx.key'
-----
ubuntu@ip-172-31-0-208:~$

Put the key into the default namespace, and call it awx-secret-tls:

ubuntu@ip-172-31-0-208:~$ microk8s kubectl create secret tls awx-secret-tls --namespace default --key awx.key --cert awx.crt
secret/awx-secret-tls created
ubuntu@ip-172-31-0-208:~$

View the secret with:

microk8s kubectl get secret --all-namespaces

Make a YAML file called my-awx.yml with the following – this names the AWX deployment and does a few other things like turn on https and create a volume that maps to the host machine’s local filesystem.  It also specifies the secret we just created.

The hostname needs to match what appears in the Subject Alternative Name of the certificate we made – otherwise, the hostname defaults to awx.example.com

The volume mapping is just something I needed to do for my particular case – you can leave out the tower_extra_volumes and tower_task_extra_volume_mounts sections if you don’t need this.:

apiVersion: awx.ansible.com/v1beta1
kind: AWX
metadata:
  name: awx
spec:
  tower_ingress_type: Ingress
  tower_ingress_tls_secret: awx-secret-tls
  tower_hostname: awx.yourname.com
  tower_extra_volumes: | 
    - name: data-vol 
      hostPath: 
        path: /home/ubuntu 
        type: Directory 
  tower_task_extra_volume_mounts: | 
    - name: data-vol 
      mountPath: /data

Create the deployment using the above yaml file:

ubuntu@ip-172-31-0-208:~$ microk8s kubectl apply -f my-awx.yml
awx.awx.ansible.com/awx created

The delete command can be used to remove the deployment too, when you need to make changes to my-awx.yml and re-apply. Check status (on a new Ubuntu install in AWS t2.medium this takes 2 minutes 13 seconds):

ubuntu@ip-172-31-0-208:~$ microk8s kubectl get pods
NAME                          READY   STATUS    RESTARTS   AGE
awx-operator-f768499d-66wjw   1/1     Running   0          3m45s
awx-postgres-0                1/1     Running   0          2m39s
awx-b5f6cf4d4-8mnx6           4/4     Running   0          2m31s

Create an ingress file that references the FQDN and the secret that was installed earlier like this:

apiVersion: networking.k8s.io/v1
kind: Ingress
metadata:
  name: awx-ingress
  annotations:
    nginx.ingress.kubernetes.io/rewrite-target: /$1
spec:
  tls:
  - hosts:
    - awx.yourname.com
    secretName: awx-secret-tls
  rules:
    - host: awx.yourname.com
      http:
        paths:
          - backend:
              service:
                name: awx-service
                port:
                  number: 80
            path: /
            pathType: Prefix

Make sure your awx pod is showing 4/4 containers running. If it is, apply the ingress rule:

ubuntu@ip-172-31-0-208:~$ microk8s kubectl apply -f myingress.yml
ingress.networking.k8s.io/awx-ingress configured
ubuntu@ip-172-31-0-208:~$

Check the ingress rule is applied correctly:

ubuntu@ip-172-31-0-208:~$ microk8s kubectl get ingress
NAME          CLASS    HOSTS           ADDRESS   PORTS     AGE
awx-ingress   <none>   awx.yourname.com             80, 443   4m53s
ubuntu@ip-172-31-0-208:~$ microk8s kubectl describe ingress
Name:             awx-ingress
Namespace:        default
Address:
Default backend:  default-http-backend:80 (<error: endpoints "default-http-backend" not found>)
TLS:
  awx-secret-tls terminates awx.yourname.com
Rules:
  Host           Path  Backends
  ----           ----  --------
  awx.yourname.com
                 /   awx-service:80 (10.1.59.71:8052)
Annotations:     nginx.ingress.kubernetes.io/rewrite-target: /$1
Events:          <none>
ubuntu@ip-172-31-0-208:~$

The above looks ok, but there’s nothing under ‘Events’.  If you set a hostname in /etc/hosts on the machine you are browsing from you will see an NGINX 404 not found message.  

Remove and reapply the ingress – note that after that is done, the events list has a CREATE event in it:

ubuntu@ip-172-31-0-208:~$ microk8s kubectl delete -f myingress.yml
ingress.networking.k8s.io "awx-ingress" deleted
ubuntu@ip-172-31-0-208:~$ microk8s kubectl apply -f myingress.yml
ingress.networking.k8s.io/awx-ingress created
ubuntu@ip-172-31-0-208:~$ microk8s kubectl describe ingress
Name:             awx-ingress
Namespace:        default
Address:
Default backend:  default-http-backend:80 (<error: endpoints "default-http-backend" not found>)
TLS:
  awx-secret-tls terminates awx.yourname.com
Rules:
  Host           Path  Backends
  ----           ----  --------
  awx.yourname.com
                 /   awx-service:80 (10.1.121.71:8052)
Annotations:     nginx.ingress.kubernetes.io/rewrite-target: /$1
Events:
  Type    Reason  Age   From                      Message
  ----    ------  ----  ----                      -------
  Normal  CREATE  3s    nginx-ingress-controller  Ingress default/awx-ingress
ubuntu@ip-172-31-0-208:~$

Make sure the hostname resolves on your computer, then browse to https://awx.yourname.com and you should see a login page (after you pass the invalid self-signed certificate warning).

I hope this helps someone else out!

A couple of troubleshooting commands:

In the case below, postgres is not starting due to a storage issue – the persistent storage hadn’t been enabled on Microk8s:

microk8s kubectl describe pod/awx-postgres-0
Name:           awx-postgres-0
Namespace:      default
Priority:       0
Node:           <none>
Labels:         app.kubernetes.io/component=database
                app.kubernetes.io/managed-by=awx-operator
                app.kubernetes.io/name=awx-postgres
                app.kubernetes.io/part-of=awx
                controller-revision-hash=awx-postgres-6f5cdc455c
                statefulset.kubernetes.io/pod-name=awx-postgres-0
Annotations:    <none>
Status:         Pending
IP:
IPs:            <none>
Controlled By:  StatefulSet/awx-postgres
Containers:
  postgres:
    Image:      postgres:12
    Port:       5432/TCP
    Host Port:  0/TCP
    Environment:
      POSTGRES_DB:                <set to the key 'database' in secret 'awx-postgres-configuration'>  Optional: false
      POSTGRES_USER:              <set to the key 'username' in secret 'awx-postgres-configuration'>  Optional: false
      POSTGRES_PASSWORD:          <set to the key 'password' in secret 'awx-postgres-configuration'>  Optional: false
      PGDATA:                     /var/lib/postgresql/data/pgdata
      POSTGRES_INITDB_ARGS:       --auth-host=scram-sha-256
      POSTGRES_HOST_AUTH_METHOD:  scram-sha-256
    Mounts:
      /var/lib/postgresql/data from postgres (rw,path="data")
      /var/run/secrets/kubernetes.io/serviceaccount from default-token-2qmrb (ro)
Conditions:
  Type           Status
  PodScheduled   False
Volumes:
  postgres:
    Type:       PersistentVolumeClaim (a reference to a PersistentVolumeClaim in the same namespace)
    ClaimName:  postgres-awx-postgres-0
    ReadOnly:   false
  default-token-2qmrb:
    Type:        Secret (a volume populated by a Secret)
    SecretName:  default-token-2qmrb
    Optional:    false
QoS Class:       BestEffort
Node-Selectors:  <none>
Tolerations:     node.kubernetes.io/not-ready:NoExecute op=Exists for 300s
                 node.kubernetes.io/unreachable:NoExecute op=Exists for 300s
Events:
  Type     Reason            Age                  From               Message
  ----     ------            ----                 ----               -------
  Warning  FailedScheduling  35s (x5 over 3m12s)  default-scheduler  0/1 nodes are available: 1 pod has unbound immediate PersistentVolumeClaims.

Connecting to a bash shell in a container. First find the pod name, then run the second command using -c to specify the container name (in this case, awx-task):

ubuntu@ip-172-31-9-88:~$ microk8s kubectl get pod awx-6dbb9946c7-86zhh
NAME                   READY   STATUS    RESTARTS   AGE
awx-6dbb9946c7-86zhh   4/4     Running   0          8m45s
ubuntu@ip-172-29-247-122:~$ microk8s kubectl exec --stdin --tty awx-6dbb9946c7-86zhh /bin/bash -c awx-task
kubectl exec [POD] [COMMAND] is DEPRECATED and will be removed in a future version. Use kubectl exec [POD] -- [COMMAND] instead.
bash-4.4$
Ansible Limit When Using Netbox as Inventory

I’m currently using Ansible to template a large and growing number of devices for an ISP that I’m working for. The last part of the process is to use Netbox as a source of truth to write the configs using Jinja2 templates. The work is done as part of a CI/CD pipeline, and runs on a specific Gitlab Runner instance – finally the config is pre-staged onto the device’s filesystem to be checked by a engineer before deployment.

I’ve been finding the growing list of hosts a bit hard work, and, seemingly undocumented in the Netbox docs is how to put a site-specific limit on the playbook run. This is easily done in regular Ansible by using .ini-style host file groups like this:

[siteA]
sitea-router001
sitea-router002

[siteB]
siteb-router001
siteb-router002

You can then do ‘ansible-playbook -l siteB’ to restrict what gets generated. How you do this when Netbox is the source of inventory is less clear.

It turns out that sites are pre-pended in Netbox with the string ‘sites_’. So, in your dynamic inventory file (in my case, called nb-inventory.yml) you need to tell it to group hosts by site by including the sites keyword under the group_by section:

plugin: netbox.netbox.nb_inventory
api_endpoint: https://YOURURLHERE
token: YOURTOKENHERE
validate_certs: False
config_context: False
group_by:
  - device_roles
  - sites

query_filters:
  - has_primary_ip: 'true'

compose:
  ansible_network_os: platform.slug

Then, the command to retrieve hosts by site is:

ansible-playbook main.yml -i nb-inventory.yml -l sites_sitea

This should return something like the following:

    "sites_sitea": {
        "hosts": [
            "sitea-router001",
            "sitea-router002"
        ]
    }

Et voila…

Viewing all 77 articles
Browse latest View live